Infographics

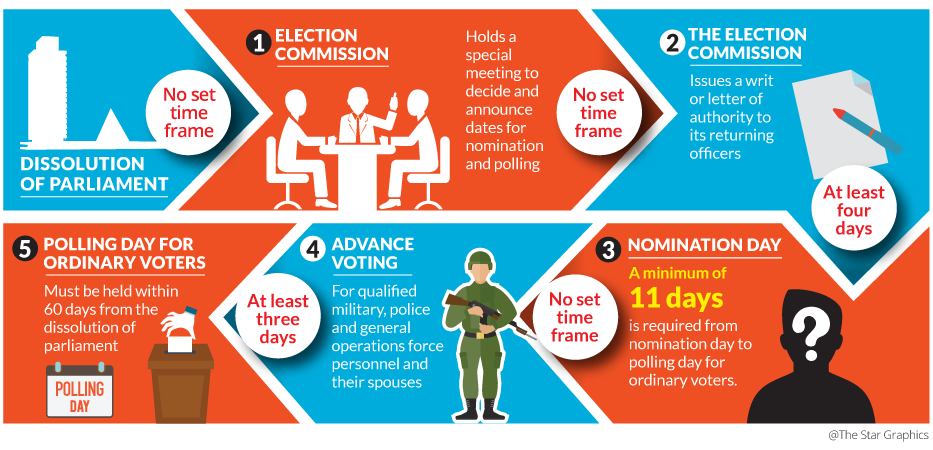
What happens after Parliament is dissolved

Dissolution of Parliament

1

Election Commission

Holds a special meeting to decide and announce dates for nomination and polling

Dissolution of Parliament

2

THE ELECTION COMMISSION

Issues a writ or letter of authority to its returning officers

Dissolution of Parliament

3

Nomination Day

A minimum of
11 days
is required from nomination day to polling day for ordinary voters.

Dissolution of Parliament

4

Advance Voting

For qualified military, police and general operations force personnel and their spouses

Dissolution of Parliament

5

Polling day for ordinary voters

Must be held within 60 days from the dissolution of parliament

Dissolution of Parliament

Tips and guidelines for voting during the 14th general elections (GE14)

Before the general elections

If you are 21 years old or over, register as a voter at any Election Commission (EC) office or post office.

Check your voter details on the Election Commission’s (EC) website (https://pengundi.spr.gov.my/) or contact their Call Centre at 03-8892 7000. The electoral roll is updated once every three months.

After parliament is dissolved, check your designated polling station on the same website.

On election day

Be at the polling station as early as possible to avoid a long queue. This will also ensure that your IC number will be taken off the electoral list and no one can misuse your name and IC number.

Upon entering the polling station, polling clerks will take down your name and IC number and cross it out of the electoral list.

A second officer will check your hands for any marks or stains, while a third officer will ask you to dip your finger in the indelible ink bottle. (It is important that you do not have any nail polish as you may not be able to vote).

Proceed to the voting booth and mark X next to the name of your chosen candidate. Be careful not to mark outside the box, or else your vote will be spoilt.

Fold your ballot paper in half, move to the ballot box and put your ballot papers in the right boxes (parliament or state).

Registered voters and overall population in each election (million)

Government budget approved for running each general election (RMmil)

Statistics of Female Voters

Women in Parliament

Peninsular Malaysia General Election Dates - A Chronology

1959 (CAMPAIGN PERIOD: 35 DAYS)

  • 27

    JUNE

    Saturday

  • 15

    July

    Wednesday

  • 19

    August

    Wednesday

1964 (CAMPAIGN PERIOD: 35 DAYS)

  • 1

    march

    Sunday

  • 21

    march

    Saturday

  • 25

    April

    Saturday

1969 (CAMPAIGN PERIOD: 35 DAYS)

  • 20

    march

    Thursday

  • 5

    April

    Saturday

  • 10

    May

    Saturday

1974 (CAMPAIGN PERIOD: 16 DAYS)

  • 31

    July

    Wednesday

  • 8

    August

    Thursday

  • 24

    August

    Saturday

1978 (CAMPAIGN PERIOD: 17 DAYS)

  • 12

    JUNE

    Saturday

  • 21

    June

    Wednesday

  • 8

    July

    Saturday

1982 (CAMPAIGN PERIOD: 15 DAYS)

  • 29

    march

    Monday

  • 7

    april

    Wednesday

  • 22

    April

    Thursday

1986 (CAMPAIGN PERIOD: 10 DAYS)

  • 19

    july

    Saturday

  • 24

    July

    Thursday

  • 3

    August

    Sunday

1990 (CAMPAIGN PERIOD: 10 DAYS)

  • 4

    October

    Thursday

  • 11

    October

    Thursday

  • 21

    October

    Sunday

1995 (CAMPAIGN PERIOD: 10 DAYS)

  • 6

    April

    Thursday

  • 15

    April

    Saturday

  • 25

    April

    Tuesday

1999 (CAMPAIGN PERIOD: 9 DAYS)

  • 10

    Nov

    Thursday

  • 20

    nov

    Thursday

  • 29

    Nov

    Monday

2004 (CAMPAIGN PERIOD: 8 DAYS)

  • 4

    march

    Thursday

  • 13

    March

    Saturday

  • 21

    March

    Sunday

2008 (CAMPAIGN PERIOD: 13 DAYS)

  • 13

    February

    Wednesday

  • 24

    February

    Saturday

  • 8

    March

    Sunday

2013 (CAMPAIGN PERIOD: 15 DAYS)

  • 3

    April

    Wednesday

  • 20

    April

    Saturday

  • 5

    May

    Sunday

2018 (CAMPAIGN PERIOD: 11 DAYS)

  • 7

    April

    Saturday

  • 28

    April

    Saturday

  • 9

    May

    Wednesday

Seats in Parliament by Parties

As of 6th April 2018

BARISAN NASIONAL (130 SEATS)

  • 84

    Umno

  • 7

    MCA

  • 4

    MIC

  • 14

    PBB

  • 1

    SUPP

  • 2

    Gerakan

  • 1

    PBRS

  • 3

    UPKO

  • 4

    PBS

  • 4

    PDP

  • 6

    PRS

PAKATAN HARAPAN (72 SEATS)

  • 36

    DAP

  • 28

    PKR

  • 7

    Amanah

  • 1

    Pribumi

OTHER PARTIES (18 SEATS)

  • 13

    PAS

  • 2

    Warisan

  • 1

    PSM

  • 2

    Independents

Note: Two seats are vacant following the death of Jelebu MP Zainudin Ismail (BN) in December 2017 and Paya Besar MP Datuk Abdul Manan Ismail (BN) in February 2018.

Parliament Seats Won - A Chronology

1959

PARTY NO. OF VOTES % OF VOTES
Alliance 800,944 51.8%
PAS 329,070 21.3%
Labour Party and Parti Rakyat (Socialist Front) 199,688 12.8%
People's Progressive Party 97,391 6.2%
Parti Negara 32,578 2.1%
Malayan Party 13,404 0.9%
Independent Candidates 79,194 4.8%
Total 1,552,269 100%

1964

PARTY NO. OF VOTES % OF VOTES
Alliance 1,204,340 58.53%
Labour Party and Parti Rakyat (Socialist Front) 330,898 16.08%
PAS 301,187 14.64%
United Democratic Party 88,223 4.28%
People's Progressive Party (PPP) 69,898 3.4%
People's Action Party (PAP) 42,130 2.05%
Party Negara 7,319 0.36%
Independents 13,509 0.66%
Total 2,057,504 100%

1969

PARTY NO. OF VOTES % OF VOTES
Alliance 1,063,238 44.34%
PAS 495,641 20.67%
DAP 286,606 11.95%
Gerakan 178,971 7.46%
People's Progressive Party (PPP) 80,756 3.37%
Sarawak United People's Party (SUPP) 71,293 2.97%
Sarawak National Party (SNAP) 64,593 2.69%
United Sabah National Organisation (USNO) 31,947 1.33%
Parti Pesaka Sarawak 30,765 1.28%
Parti Rakyat 25,785 1.08%
Sabah Chinese Association 24,699 1.04%
United Malaysian Chinese Organisation 1,808 0.08%
Independents 41,710 1.74%
Total 2,397,812 100%

1974

PARTY NO. OF VOTES % OF VOTES
Barisan Nasional 1,287,400 60.81%
DAP 387,845 18.32%
Sarawak National Party (SNAP) 117,566 5.55%
Parti Keadilan Masyarakat Malaysia 105,718 4.99%
Malaysian People's Socialist Party (PSRM) 84,206 3.98%
Kesatuan Insaf Tanah Air (KITA) 8,623 0.41%
Independent People's Progressive Party (IPPP) 1,356 0.06%
Independents 124,202 5.88%
Total 2,116,916 100%

1978

PARTY NO. OF VOTES % OF VOTES
Barisan Nasional 1,987,907 57.23%
DAP 664,433 19.13%
PAS 537,720 15.48%
Independents 160,370 4.62%
Other parties 112,850 3.25%
Sarawak People's Organisation 10,150 0.29%
Total 3,473,430 100%

1982

PARTY NO. OF VOTES % OF VOTES
Barisan Nasional 2,522,079 60.54%
DAP 815,473 19.58%
PAS 602,530 14.46%
Other parties 68,386 1.64%
Independents 157,229 3.78%
Total 4,165,697 100%

1986

PARTY NO. OF VOTES % OF VOTES
Barisan Nasional 2,649,238 57.28%
DAP 975,544 21.09%
PAS 716,952 15.50%
Other parties 136,635 2.95%
Independents 146,903 3.18%
Total 4,625,272 100%

1990

PARTY NO. OF VOTES % OF VOTES
Barisan Nasional 2,985,392 53.38%
Semangat 46 *# 826,398 14.77%
DAP * 985,228 17.61%
Parti Bersatu Sabah (PBS) * 128,260 2.29%
PAS # 391,813 7.01%
Independents and other parties 276,136 4.94%
Total 5,593,227 100%

*Gagasan Rakyat
#Angkatan Perpaduan Ummah

1995

PARTY NO. OF VOTES % OF VOTES
Barisan Nasional 3,881,214 65.16%
Semangat 46 # 616,589 10.35%
DAP 712,175 11.96%
PBS 198,594 3.33%
PAS # 430,098 7.22%
Independents and other parties 118,025 1.98%
Total 5,956,695 100%

#Angkatan Perpaduan Ummah

1999

PARTY NO. OF VOTES % OF VOTES
Barisan Nasional 3,748,511 56.53%
PAS * 994,279 14.99%
DAP * 830,870 12.53%
Keadilan * 773,679 11.67%
PRM * 68,990 1.04%
PBS 143,342 2.16%
State Reform Party (STAR) 23,354 0.35%
Malaysian Democratic Party (MDP) 8,001 0.12%
Berjasa 409 0.01%
Angkatan Keadilan Insan Malaysia (Akim)  274 0.01%
Independents 39,385 0.59%
Total 6,631,094 100%

*Barisan Alternatif

2004

PARTY NO. OF VOTES % OF VOTES
Barisan Nasional 4,454,215 63.85%
PAS * 1,069,569 15.33%
PKR * 602,781 8.64%
DAP 702,243 10.07%
Sarawak National Party (SNAP) 28,579 0.41%
State Reform Party (STAR) 6,270 0.09%
United Democratic Sabah People’s Power Party (SETIA) 2,143 0.03%
Malaysian Democratic Party (MDP) 1,107 0.02%
United Pasok Nunukragang National Organisation (PASOK) 543 0.01%
Independents 108,096 1.55%
Total 6,975,546 100%

*Barisan Alternatif

2008

PARTY NO. OF VOTES % OF VOTES
Barisan Nasional 4,082,411 51.39%
PKR * 1,509,080 19%
PAS * 1,140,676 14.36%
DAP * 1,118,025 14.07%
Parti Rakyat Malaysia (PRM) 19,126 0.24%
Sarawak National Party (SNAP) 12,567 0.16%
United Pasok Nunukragang National Organisation (PASOK) 1,023 0.01%
Federated Sabah People's Front (BERSEKUTU) 942 0.01%
Independents 60,424 0.76%
Total 7,944,274 100%

*Pakatan Rakyat

2013

PARTY NO. OF VOTES % OF VOTES
Barisan Nasional 5,237,699 47.38%
PKR * 2,254,328 20.39%
DAP * 1,736,267 15.71%
PAS * 1,633,389 14.78%
State Reform Party (STAR)  45,386 0.41%
Pan-Malaysian Islamic Front (BERJASA) 31,835 0.29%
Sarawak Workers Party (SWP) 15,630 0.14%
Sabah Progressive Party (SAPP) 10,099 0.09%
Love Malaysia Party (PCM) 2,129 0.02%
Parti Kesejahteraan Insan Tanah Air (KITA) 623 0.005%
Malaysian United People’s Party (MUPP) 257 0.005%
Independents 86,935 0.78%
Total 11,054,577 100%

*Pakatan Rakyat